Thursday, March 13, 2014

Comparable Companies Analysis - The Boeing Company


The target is Boeng Company (NYSE : BA) and selected trading comps are Lockheed Martin Corporation (NYSE : LMT) and Northrop Grumman Corporation (NYSE : NOC) . Although the target is BA, opinions and price targets are determined for every trading comps' stock.
Thereby, suggestions are made for a 3-month investment and a longer-term 1-year investment.
Data dates back to February 4th, but this will not affect anything about the estimate, because the multiples and price have remained similar.

The 2013-year comparison between The Boeing Company, Lockheed Martin Corporation and Northrop Grumman Corporation on February 4th.
Trading Multiple
BA
LMT
NOC
Mean(average)
Current share price
122.8
148
111.4
-
% of 52-wk.high
85%
91%
90%
-
Enterprise Value
93 210 mln.
8 453 mln.
28 881 mln.
-
P/E
24
16.4
13.3
17.9
P/S
1.09
1.1
0.98
1.06
P/B
24.8
N/A
N/A
N/A
EV/EBITDA
14.2x
1.88x
5.37x
7.15x
EV/SALES
1.08x
0.18x
1.17x
0.81x
Leverage
1.47x
1.37x
1.42x
1.42x
ROE
43.7%
120%
19.4%
61%
ROA
0.51%
8.0%
7.4%
5.3%
Gross margin
7.6%
9.9%
21.8%
13.1%
EBITDA margin
15.4%
9.2%
12.7%
12.4%
Net profit margin
5.3%
6.6%
7.9%
6.6%
Ex-dividend
N/A
2.10%
1.80%
-
Dividend Yield
12.02.2014
27.02.2014
27.11.2013
-
Opinion
Strong Buy
Sell
Hold
-
Price target
150$
140$
120$
-

  • Next 3-month recommend to BA, because it had disappointing 4th quarter results, but RSI has fallen to 30-40 zone. Although EBITDA has suffered because of operating expenses, its COGS (cost of goods sold) still have not been suffering. It is indicated by the increase of EV/EBITDA and Gross profit margin. Its asset base compared to liabilities is still much stronger than its trading comps' NOC and LMT.
  • Next 1-year recommend to NOC, because it shows high margins for a company smaller than Boeing, which are great indicators for future positively surprising results. Although NOW has risen 85% since January 2013 and a correction down to 100pt should be expected, the long-term investment bought from 100pt level is recommended. Equivalently it has lower P/E and P/S than its trading comps. Sure, P/B is negative, because NOC has higher liabilities than assets. That ought not to affect high margins and earnings growth, unless the whole economic starts to stumble as feared. If market is feared to be crashing, the price target should be approximately divided by three, because this is were   

Tuesday, March 11, 2014

Comparable Companies Analysis - Nokia Corporation


Target is Nokia Corporation (NYSE : NOK) and selected trading comps are Apple Inc. (NASDQW : AAPL) Samsung Electronics Co. (NYSE : SSNFL) and Blackberry Limited. (NASDAQ : BBRY).
Athough the target is NOK, opinions and price targets are determined for every trading comps' stock. Thereby, suggestions are made for a 3-month investment and a longer-term 1-year investment.
Data dates back to February 16th, but this will not affect anything about the estimate, because the multiples and price have remained similar.

Trading Multiple NOK AAPL SSNFL BBRY Mean
(average)
Current share price 7.14 544 1250 8.98

% of 52-wk.high 87% 94% 84% 53.4%

Enterprise Value (millions) 9 460 126 250 106 689 7448

P/E 159 13.3 44 N/A 72.1
P/S 2.1 2.89 5.75 0.59 2.8325
P/B 8.6 4.19 11.8 1.76 6.5825
EV/EBITDA 8.76 2.58 1.95 N/A 13.29
EV/SALES 0.74 0.74 2.4 0.93 1.293
Leverage 6.18 0.35 0.2 N/A 2.243
ROE 2.08% 30.6% 25.9% -66.8% -2.055%
ROA 59.8% 19.3% 17.4% -92.9% 0.9%
Gross margin 11.3% 37.6% 39.8% -9.94% 19.7%
EBITDA margin 8.5% 28.7% 24.0% -110.4% -12.3%
Net profit margin 1.3% 21.7% 13.1% -90.0% 13.6%
Ex-dividend 4.05.2012 6.02.2014 27.12.2013 N/A

Dividend Yield N/A 2.30% 1.02% N/A

Opinion Hold Buy Buy Hold

Price target
8 $
600 $
1400 $
10 $


1-year comparison between Nokia, Apple, Samsung and Blackberry on February 16th


  • Next 3-months recommendation to Samsung, because April 11 Samsung launches a new smarthphone Galaxy S5, which has a 5.2-inch screen and many other impoved features. The only worrying factor for the reviewers seems to be non-evolutionary design. Nonetheless, stock price has also been decreasing in last two months, so there is room to grow. In addition, their substantial market share in China remains, because Apple has not been doing very well there and trading multiples indicate Samsung has low debt (leverage multiple), P/E is reasonable for a growth stock and margins are only slightly lower compared to Apple.

  • Next 1-year recommendation to Apple, because as usual they represent their products in autumn and hopefully the high expectations help the stock maintain its bullish trend. Also, Apple has started developing its own wristwatch with a bending screen and new iPhone software integrated into cars. In addition, Apple has the best trading multiples compared to its trading comps (competitors). All in all, Apple has higher margins and other multiples are relatively better.

Monday, March 10, 2014

Comparable Companies Analysis


Though there are many techniques to analyze company's financial results, comparable companies
analysis might be considered the one to begin with. The version presented here is slightly primitive compared to analyses made at financial institutions, because it makes it easier to grasp the subject in the beginning. Before presenting examples, it is useful to be familiar with the formulas and know where it is most simple to find the information necessary in order to conduct an analysis. Googling will provide  the filings, but the most accurate is always the data under investor relations, which is located on every company's personal website.


Joshua Rosenbaum and Joshua Pearl “Investment Banking”


Conducting Comparable Companies Analysis

  • Investor picks a company stock of his choosing – target
  • Companies from same sectors, possibly similar size (small/medium/large-cap) and operating region to compare the target with – trading comps.
  • Choose the most accurate indicators for certain industry in order to decide whether the stock is overvalued or undervalud – trading multiples


Market Valuation

Equity Value = Share Price x Fully Diluted Shares (Basic Shares Outstanding + “In-the-money” Options + “In-the-money Convertible Securities)

Enterprise Value = Equity Value + Total Debt + Preferred Stock + Noncontrolling Interest – Cash and Cash Equivalents

Profitability - the higher the better

Gross Margin = Gross Profit (Sales*-COGS**) / Sales

*Sales = Revenue = Turnover
**COGS – Cost Of Goods Sold

Companies always seek to increase gross profit margin through improving the efficiency of the manufacturing process. Other losses besides COGS are called operating expenses.


EBITDA Margin = EBITDA / Sales

Used to indicate performance among peer companies (same areas of business), reduces the importance of different regions that have different taxes and interest rates.

Net Income Margin = Net Income* / Sales

*Net Income = Earnings = Profit

Essential in order to increase EPS (earnings per share), which is the most common and important indicator for the market's decision towards the stock.

Return on Investment – the higher the better

ROE margin = Net Income / Average Shareholders' Equity

ROE = Return on Equity

Average Shareholders' Equity is calculated by summing up Total Equity of current year and prior year and dividing with 2.
For example : Company named XYZ has Total Equity of 1500 million euros in 2012 and 2500 million euros in 2013.
Average Shareholders' Equity = 1500 + 2500 / 2 = 2000 million euros

Measures the return generated on the equity provided to a company by its shareholders.
ROA margin = Net Income / Average Shareholders' Assets

ROA = Return on Assets

Calculating the Average Shareholders' Assets is the same as Average Shareholders' Equity.

Measures the return generated by a company's asset base.

Dividend Yield = Most Recent Annual Dividend Per Share / Share Price

Annual Dividend = Quarterly Dividend x 4

Credit Profile – the lower the better

Leverage = Debt / EBITDA

Leverage refers to a company's debt level. Reveals a great deal about financial policy, risk profile and capacity for growth. The higher a company's leverage, the higher its risk of financial distress and bankruptcy due to the burden associated with greater expense and principal repayments. This ratio can be viewed as the measurement of how many years of a company's cash flows are needed to repay its debt.

Financial Results to Share Price

P/E = Share Price / EPS (Earnings Per Share)

P/S = Share Price / Sales

P/B = Price Share / Book Value (Total Assets – Total Liabilities – Intangible Assets)

Financial Results to Enterprise Value

EV/EBITDA = Enterprise Value / EBITDA

EV / Sales = Enterprise Value / Sales


Conclusion

Although the next step would be benchmarking the companies, the first aquaintance ought to be made with trading multiples before moving forwards.
Benchmarking means determining the intervals to the trading multiples that include enterprise value while considering other multiples as well. Afterwards based on the benchmarking, the intervals for implied enterprise value and therefore the implied share price shall be calculated.
For now, the price targets and opinions are formed not through benchmarking, but by taking into account all trading multiples of the comparable companies and comparing these to each other in order to reach the conclusion.


Thursday, February 20, 2014

How long can financial markets continue rising before the decline ?


The next chapter of this blog will present analysis for companies of different sectors. Though it is going to be a bulk of the material, some of the necessary formulas used in analysis will be brought forward as well. Considering that all target companies are public and traded at NYSE, it is important to take a view at the state of current economy. The purpose for this blog remains – to increase interest, knowledge and confidence of a younger generation towards the world of investment banking.


What is quantitive easing ?
A year ago economy of the US was struggling with external debt. It has not yet been resolved, but a temporary solution has been found through tapering. Firstly, past two years the Fed has been conducting a programme called quantitive easing. To begin with, banks have been making money not by lending money to businesses and individuals, but rather from buying 10-year treasuries, because it has lower risk compared to the borrowing to business/individual. That takes money off the market, which is bad for the country's (in that case United States) economy. Following that, the government has found a solution. This is, to put mildly, central bank or Federal Reserve in that case, buying toxic assets* from banks for 85 billion a month. 

*toxic assets -
  • CDO - Collateralized Debt Obligations
  • Bad loans to bankrupt companies etc.
  • Mortgage-Backed Securities


How QE has an impact on the banks ?
Firstly, through buying assets from banks and by that lending money to financial institutions the Fed hopes that banks would be more eager to lend that money on to the clients. Secondly, the Fed (government) buys the treasuries in the market. The yield of the treasuries decrease, because demand grows. That creates less incentive for the banks to buy those bonds and increases the likelihood them starting to look for other investments. Therefore, banks start lending money to individuals/businesses in order to make money. All in all, QE stimulates economy by increasing the cash flow without directly accelerating money printing in the meantime.


How QE has an impact on the economy ?
As a result, due to QE national debt has been surging. Fed has discovered that QE has had more impact on the economy than anticipated. With the growing money flow, more risks have been taken by investors, allowing them to invest into emerging markets. In order to continue these investments, Fed would have to gently grow QE of 85 billion dollars a month. They have decided to act otherwise and start 'tapering', because the first time in the history of the US is not capable of meeting their obligations. 


What is 'tapering' ?
Tapering is a term, which was used first on May 22nd and it means to reduce QE by 10 billion every month. Tapering begun in December. Consequently the economies of emerging markets have been falling since May. That is because investors, who are familiar with the situation and with a bit lower risk-tolerance, are selling stocks and investing into bonds.


2-year period
EWZ – Brazil Stock Market index
GDAXI – Germany Stock Market index
N225 – Japan Stock Market index
EEM - Emerging Markets index
GSPC – S&P 500 US. Market index


Why start tapering ?
It is simple to see a pattern here. Indexes such as Nikkei 225, Emerging Markets and Brazil took a huge setback from 22nd May. Fed anticipates that the global economy has become strong and self-sustainable. It enables them to start tapering, because the stimulus from QE in order to keep interest rates low had its effect and it is time to cut back from the bond-buying program in order to focus on lowering national debt.


How tapering has an impact on the economy ?
Tapering remains dependant on the US economy, so the pace of reducing 10 million a month could always be modified. Assuming it remains the same, tapering will be finished by September and there will be no more significant support from the Fed. Assuming the Fed will not come up with another programme. Impacts such as weakening of emerging markets' currencies will start to affect the western economies. The purchase power of emerging markets decreases, therefore the incomes for global companies fall. Thereby, stock prices decrease resulting in a snowball effect. By then, the so called taxi drivers will have their money invested in stocks, because if there are sellers familiar to the overvalued situation of the economy, there have to be buyers too.


Triple bottom support and resistance chart.


S&P 500 index from 1995 to current


Rise of the S&P 500 and finding a new resistance
Considering that in September Fed will have stopped considerably supporting economy and the currencies of emerging markets have slumped, there is a chance for a correction. Since the S&P 500 broke the 1600pt resistance 9-months ago, it has risen to 1850pt level, which indicates 15.7% raise. Currently, huge masses are just entering the US market, implying the S&P 500 is estimated to rise to 2100pt level by September. The new resistance and the support at 1600pt level ought to form approximately at that level and a new decline on the markets might be expected. That statement is supported by the fact that some experts estimate the S&P 500 index to be at a 50 000pt level by the year  2050.


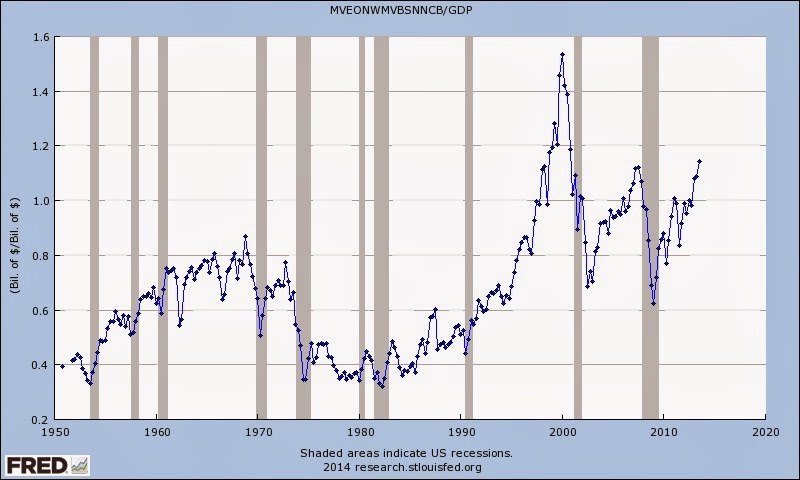
Market Cap to GDP, also known as Warren Buffett indicator


Saturday, April 6, 2013

Analyzing the company's financial results (PEG, P/CF, EV/EBITDA, DY)

This time we proceed analyzing Apple Inc. stock, starting with PEG, because it has a direct connection to P/E. Let's continue with the previous data, current price being 431.72, because in that case the comparison is more accurate.

PEG - price/earnings to growth

P/E ratio/Annual EPS Growth 

In the last post we calculated P/E of 9.67, shall continue with that.

9.67 (P/E) / 15.90 % (estimates to 2013 sales growth from YAHOO! Finance) x 100% =  0.61

  • The PEG ratio that indicates an over or underpriced stock varies by industry and by company type, though a broad rule of thumb is that a PEG ratio below one is desirable.


P/CF - price / cash flow


The argument for using cash flow over earnings is that the former is not easily manipulated, while the same cannot be said for earnings, which, unlike cash flow, are affected by depreciation and other non-cash factors.


P/CF per share = 50 856 million (annual operating cash flow) / 939 million(shares outstanding)= 

                                                                                      = 54.2 

P/CF = 431.72 (current share) / 54.2 (cash flow per share) = 8

Sometimes free cash flow is used instead of operating cash flow to calculate the cash flow per share figure. 

  • Investors need to remind themselves that there are a number of non-cash charges in the income statement that lower reported earnings. Recognizing the primacy of cash flow over earnings leads some analysts to prefer using the P/CF ratio rather than, or in addition to, the company's P/E ratio. Don't forget to compare this indicator to the company's competitors in the sector. That's because they could be very different depending on the sector. In Apple's case technology. The main competitors can also be found from Yahoo! Finance.


EV/EBITDA - enterprise multiple

A ratio used to determine the value of a company.


Enterprise value is calculated as market cap plus debt, minority interest and preferred shares, minus total cash and cash equivalents. 

EV = market cap. + debt + minority interest + preferred shares - cash and cash equivalents* =

397 410 million + 0 (has no debt) + 1.1 million + 5 million (No. preferred shares) x 431.72 (current share price) - 121 251 million (cash and cash equivalents) = 278 318.7 million (EV)

*cash and cash equivalents - An item on the balance sheet that reports the value of a company's assets that are cash or can be converted into cash immediately. Examples of cash and cash equivalents are bank accounts, marketable securities and Treasury bills.

EBITDA (earnings before interests, taxes, deprication and amortization) is essentially net income with interest, taxes, depreciation, and amortization added back to it, and can be used to analyze and compare profitability between companies and industries because it eliminates the effects of financing and accounting decisions.


EBITDA = 156 508 million (revenue/turnover/ net sales) + 14 030 (income taxes) + 0 (no interests in any other companies) + 3 277 million (deprecation and amortization) - 13 421 (total operating expenses) = 160 394 million

EV/EBITDA = 278 318.7 million / 160 394 million = 1.74 


DY - dividend yield

A financial ratio that shows how much a company pays out in dividends each year relative to its share price.

DY = annual dividend per share / share price

Apple intends to pay out 2.65 dollar dividend per share quarterly aka four times in a year.

DY = 2.65 X 4 (annual dividends per share) / 431.72 (share price) = 0.025 = 2.5%

It means if you own Apple shares for 10 000 dollars, you'll get 62.5 dollars worth of dividends every quarter, which makes 250 dollars in a year.


What is going on with my portfolio?


  • Long-term stocks : 
C +2.4%

F  -7%

PFE +12.2% 

Average +2.53%


  • Short-term stocks :
Good thing i sold ITMN, because now it's -8%, compared to -2.6% according to my previous post.

SBUX +7.7% Though I like Starbuck's chart, I will sell, because otherwise it wouldn't be a 
short-term stock.

My takes : 

NDAQ - Nasdaq got many bad news and many opinions suggested that it will be falling in a short-term. Well, they were accurate, because it did fall 15% in one day. But I think it's just a dip. Also RSI* indicator fell to 23. Which means it's oversold and likely to rise.


CLF - it's a pretty huge risk, seeing it has been falling a lot in past 3 months. But I'm willing to take it for a small rise, because if the RSI hits 30 from 29 (currently), then it might hit up 5-10%.


*RSI (Relative strength index) - ranges from 0 to 100. An asset is deemed to be overbought once the RSI approaches the 70 level, meaning that it may be getting overvalued and is a good candidate for a pullback. Likewise, if the RSI approaches 30, it is an indication that the asset may be getting oversold and therefore likely to become undervalued. 

S&P 500 is +6.2% in year 2013 and from the beginning of this test (portfolio).


Short-term stocks have done better than the long-term according to present prices. But worse than S&P 500. Let's see what the next 2 weeks deliver.