The next chapter of this blog will
present analysis for companies of different sectors. Though it is
going to be a bulk of the material, some of the necessary formulas
used in analysis will be brought forward as well. Considering that
all target companies are public and traded at NYSE, it is important
to take a view at the state of current economy. The purpose for this
blog remains – to increase interest, knowledge and confidence of a
younger generation towards the world of investment banking.
What is quantitive easing ?
A year ago economy of the US was
struggling with external debt. It has not yet been resolved, but a
temporary solution has been found through tapering. Firstly, past two
years the Fed has been conducting a programme called quantitive
easing. To begin with, banks have been making money not by lending money to businesses and individuals, but rather from buying 10-year treasuries, because it has lower risk compared to the borrowing to business/individual. That takes money off the market, which is bad for the country's (in that case United States) economy. Following that, the government has found a solution. This is, to put mildly, central bank or Federal Reserve in
that case, buying toxic assets* from banks for 85 billion a month.
*toxic assets -
- CDO - Collateralized Debt Obligations
- Bad loans to bankrupt companies etc.
- Mortgage-Backed Securities
How QE has an impact on the banks ?
Firstly, through buying assets from banks and by that lending money to financial institutions the Fed hopes that banks would be more eager to lend that money on to the clients. Secondly, the Fed (government) buys the treasuries in the market. The yield of the treasuries decrease, because demand grows. That creates less incentive for the banks to buy those bonds and increases the likelihood them starting to look for other investments. Therefore, banks start lending money to individuals/businesses in order to make money. All in all, QE stimulates economy by increasing the cash flow without directly accelerating money printing in the meantime.
How QE has an impact on the economy ?
As a result, due to QE national debt
has been surging. Fed has discovered that QE has had more impact on
the economy than anticipated. With the growing money flow, more risks
have been taken by investors, allowing them to invest into emerging
markets. In order to continue these investments, Fed would have to
gently grow QE of 85 billion dollars a month. They have decided to
act otherwise and start 'tapering', because the first time in the
history of the US is not capable of meeting their obligations.
What is 'tapering' ?
Tapering is a term, which was used first on May 22nd and
it means to reduce QE by 10 billion every month. Tapering begun in
December. Consequently the economies of emerging markets have been
falling since May. That is because investors, who are familiar with
the situation and with a bit lower risk-tolerance, are selling stocks
and investing into bonds.
2-year period
EWZ – Brazil Stock Market index
GDAXI – Germany Stock Market index
N225 – Japan Stock Market index
EEM - Emerging Markets index
GSPC – S&P 500 US. Market index
Why start tapering ?
It is simple to see a pattern here.
Indexes such as Nikkei 225, Emerging Markets and Brazil took a huge
setback from 22nd May. Fed anticipates that the global
economy has become strong and self-sustainable. It enables them to
start tapering, because the stimulus from QE in order to keep
interest rates low had its effect and it is time to cut back from the
bond-buying program in order to focus on lowering national debt.
How tapering has an impact on the economy ?
Tapering remains dependant on the US
economy, so the pace of reducing 10 million a month could always be
modified. Assuming it remains the same, tapering will be finished by
September and there will be no more significant support from the Fed.
Assuming the Fed will not come up with another programme. Impacts
such as weakening of emerging markets' currencies will start to
affect the western economies. The purchase power of emerging markets decreases, therefore
the incomes for global companies fall. Thereby, stock prices decrease
resulting in a snowball effect. By then, the so called taxi drivers
will have their money invested in stocks, because if there are
sellers familiar to the overvalued situation of the economy, there
have to be buyers too.
Triple bottom support and resistance
chart.
S&P 500 index from 1995 to current
Rise of the S&P 500 and finding a new resistance
Considering that in September Fed will
have stopped considerably supporting economy and the currencies of
emerging markets have slumped, there is a chance for a correction.
Since the S&P 500 broke the 1600pt resistance 9-months ago, it
has risen to 1850pt level, which indicates 15.7% raise. Currently,
huge masses are just entering the US market, implying the S&P 500
is estimated to rise to 2100pt level by September. The new resistance and the support at 1600pt level ought to form approximately at that level and a new decline on the
markets might be expected. That statement is supported by the fact that
some experts estimate the S&P 500 index to be at a 50 000pt level
by the year 2050.
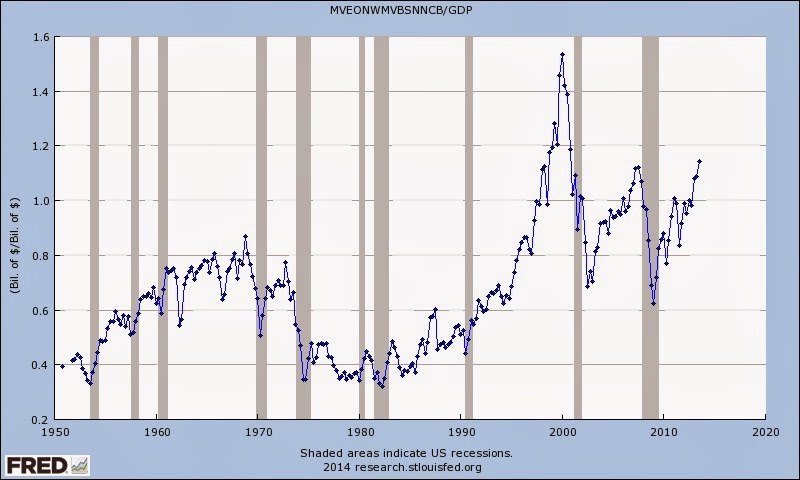
Market Cap to GDP, also known as Warren
Buffett indicator


