Saturday, March 9, 2013

Analyzing the company's financial results (P/E, P/B, price/sales)

Every investor should've heard a name Warren Buffet at least once. But only few are familiar with his the tactics of choosing his investments. The world's richest man/investor has his own ways.
When all the bankers suggests to diversify the risk and buy different stocks from different sectors, Mr. Buffett figures, he should put all his eggs into one basket. Which means that he understands the company, he's investing into, very thorough. By reading company's financial statements, getting to know the board of directors and managers and of course, about the company's products. That's the way he has an average 20% yield in a year, for his 60 years in business. It seems easy, but I certainly believe, It's very difficult to do and even more difficult to learn.

But to start, I will try analyzing the one company that probably has been written about by every business newspaper - Apple Inc.

Apple has been having lots of difficulties in the last year and though many analysts have their opinions, I want to follow one of Buffett's rules - be independent. Here's the 2012 annual report. Lots of data, our job is to find the important parts : http://investor.apple.com/secfiling.cfm?filingID=1193125-12-444068


Apple 2012 financial data.

*will mark (million) in replacement for 1 000 000  in sake of better understanding.

P/E (price to earnings ratio)
Market Value per ShareEarnings per Share (EPS)
431.72 (current share price)  
Earnings per share 44.64 . 

P/E = 431.72 (current share price) / 44.64 (earnings per share) = 9.67


  •  Normal P/E is 10-30, less is underrated and over is overrated. Which means, by P/E Apple's current share price is too low and should be higher. It indicates the present price and company result ratio. But it's very important to compare the P/E to other technology sector companies! 


*retained earningsThe percentage of net earnings not paid out as dividends, but retained by the company to be reinvested in its core business or to pay debt. Money coming from earnings of the company and invested back to business either for loans or development. Gives information about company's intentions for growth in the future.


P/B (price to book or price-equity ratio)

Price-To-Book Ratio (P/B Ratio)

431.72 (current share price)  

Total assets 176 064 (million) 
Intangible assets (Acquired intangible assets + Goodwill) 5 359 (million)
Total liabilities 57 854 (million) 

176 064(million; total assets) - 5 359 (million; intangible assets) - 57 854 (million; total liabilities) 
                                                    / 938.75 (million; shares total) = 120.2 (Book value per share)

P/B = share price / book value per share = 431.72 / 120.2 = 3.6


  •  This ratio also gives some idea of whether you're paying too much for what would be left if the company went bankrupt immediately.If a company is trading for less than its book value (or has a P/B less than one), it normally tells investors one of two things: either the market believes the asset value is overstated, or the company is earning a very poor (even negative) return on its assets. 
        Normal P/B is 1 to 1.5. For long-term investment, below's underrated, above is overrated.


*intangible assetsAn asset that is not physical in nature. Corporate intellectual property (items such as patents, trademarks, copyrights, business methodologies), goodwill and brand recognition are all common intangible assets in today's marketplace.

*liability - includes loans, accounts payable, mortgages, deferred revenues and accrued expenses. Liabilities are a vital aspect of a company's operations because they are used to finance operations and pay for large expansions.


Price / Sales


431.72 (current share price)  

12-month (2012) Revenue aka net sales 156 508 (million)
Shares total 938.75 (million)

Revenue (net sales) per share = 156 508 (million) / 938.75 (million) = 166.7 

PSR = 431.72 / 166.7 = 2.6

* price/sales - the price-to-sales ratio can vary substantially across industries; therefore, it's useful mainly when comparing similar companies. Because it doesn't take any expenses or debt into account, the ratio is somewhat limited in the story it tells.

Today's analysis conclusion

According to Yahoo! Finance's data, 
P/E = 9.79
P/B = 3.17
PSR = 2.46

Looks like self-made calculations might be more fresh and accurate. Simply because the data on 
internet sometimes could not be the right and might sometimes be a little out-of-date.
In next post we'll go deeper in anaylzing and take on next concepts.


What is going on with my portfolio?


  • First, my long-term stocks :
C +11.2% 
F  -3%
PFE +8.7%
Average +5.63%

In comparison, S%P 500 has risen 10% in last 3 months (the time I've been writing this blog and starting this test between long-term and short-term stocks). I'm still behind the index, which shows a great lack of skill in choosing stocks. But important is developing yourself.

  • My speculation stocks : 
ITMN -2.6% will sell, because price/sales is 23 and p/b 9.2 and p/e cannot be calculated when there's no profit. Also, nothing to wait for in the future.
SBUX +9.4% will hold - p/e 31.6, p/b 8.4, price/sales 8.2 - though these indicators are a little too high, I believe in this brand, because with economic growth people are willing to spend more and also it has a steady bullish trendline.

Average +3.4% 
S&P 500 has risen 10%

Still, the long-term stocks have been better. I will search for the new bunch of short-term stocks for the next time.


Sunday, February 24, 2013

Are we moving towards the next crisis?

It has been almost six years from the last bubble explosion in the last quarter of 2007. There was 7 years between 2000 and 2007 boom. Investors have restored their faith in the economic growth. Including taxi drivers. The S&P 500 is at the same level as before.


  • Interest rates - the amount charged by a lender (takes the loan) to borrower (gives the loan) for use of his assets.

The mother of all bubbles is speculation and leverage debt. The lower interest rates are, faster the economy improves, because people are more keen to lend money from banks, which is the main initiator of the rise from crisis.
Easy to notice, with every boom, interest rate grows, so banks could get more revenue. Because people are lending anyways. Currently the prime interest rate of US is 3.25% .
I only have one question. Why don't the banks already increase the interest rate? Perhaps, because people haven't been lending money yet. Maybe they have enough vacant money from selling all their assets from the financial crisis (the last crisis) so they don't have to lend. But same time, why not make some money on the stock market? "I want to beat the inflation." would be a good explanation.


  • S&P 500 is at the same level as it was in 2000 and 2007 . It means the market capitalization of those 500 America's biggest companies (the amount of the money on the NYSE and Nasdaq stock market) has grown almost two times in the past 5 years. I don't think it makes any sense compared to the revenues of the companies.


  • News and articles
First of all, many economists like Roubini for example have expressed concerns about market being too rapidly growing. Probably some cautious investors are taking their money out now. But this is a zero sum game. Someone has to put their money, in that case. Now...this someone is probably one of the so-called taxi drivers that enter the market too late.
http://finance.yahoo.com/blogs/daily-ticker/nouriel-roubini-bullish-now-mother-bubbles-begun-140143386.html - The Mother of All Bubbles has begun.

Also, I found an article from 22july 2007, 2 months before the recession. It truly demonstrates the optimism of analysts, though there are strong signs of instablity. 
http://finance.yahoo.com/blogs/daily-ticker/nouriel-roubini-bullish-now-mother-bubbles-begun-140143386.html

In conclusion out of Dow Jones Industrial Average 30 companies - 1 has no P/E (no profit), 25 has 0-20, two has 20-40 and also two has P/E of over 40. Also in 2007, the average S&P 500 P/E was close to 65. In the moment it's 17.2 . It means that the market has not yet overreacted.
Though the indexes have already reached the same level as before, I remain confident that the recession is not yet coming, but I believe it will take 6 months until we can see the the signs changing, P/E growing and taxi drivers talking about stock market. I would agree to Roubini's article. Short-term positive and long-term catastrophic.
In the end, a little note from Warren Buffet : "Be greedy when others are fearful and fearful when others are greedy."


Wednesday, January 16, 2013

Past few days have been busy, so I didn't have any time to update the blog. It's been as busy as the stock exchange in a past two weeks.

Everything looks up and in the moment it's the middle-age of economy's rising cycle. I hope it continues for another 3 years, but the S&P 500* (blue line) is concerning me. It has already reached the level of the last two economic booms. What if the 'economic cycle acceleration' theory is true? Basically couple years ago I was wondering about a possibility that the period between economic crisis and booms might get shorter. That's because : 90% of the world's wealth is owned by 10% of the population. Also, what is hard to measure, but true is that 10% of the population have much greater financial intelligence than the rest. So what happens? The smart rich people gain a lot of money every crisis by buying from bottom and selling in top. Also they do short selling* which basically means betting on the stock to decrease. Some people start to understand these patterns, but even more
(the 90% of fools) give away money.
In case of market's fool, It's like an investment firm. You don't take out money from the account in case you really don't need it. Because from every disposal, the government takes taxes. How much? Depends on the country. In Estonia, 20%. It's better to trade with 1000€ rather than 800€. Assuming you're gonna gain of course.
That's why these cycles might happen more rapidly in the decades coming. For example, take a look at the history. Technology bubble 1990, internet bubble 2000, financial bubble 2008. What next? Aftershock bubble 2015 maybe? It's should be noticed that the periods have decreased. Last one was in 8 years from the previous one. According to this, next one could be 2016. Because It's amazing how fast people's psychology changes. Today, a young woman gave me back my one euro coin that I had dropped. She could've kept it easily. Now that shows that the greed is gone for a moment there. But when people hear about the money made at the stock market by the smart people, they want in. Then the greed emerges again.


  • Now, about my next indicator for analyzing stocks. This is a chart from 1994 to now. On that chart, there's S&P 500 (blue line) and BAC (red line) aka Bank of America. Same time the other banks have been rising along with the S&P 500, BAC has not. Which gives me a reason to buy, because many stocks have already made their fast climb. Why shouldn't BAC. Also USA would never let a huge bank like this go declare bankruptcy. So that will be another indicator I'll be testing by purchasing BAC.


What is going on with my portfolio?


  • First, my long-term stocks : 

C +1.3%
F +6.1%
PFE +2.5%
Average +3.3%

In comparison, S&P 500 has risen 4% in 6 weeks. That's the time I've been writing this blog.
Looks like I should be doing a lot better if I want to beat the market. Keep learning and keep trying.
Good quote for this:
"Give me guys who are poor, smart, hungry - and no feelings. When you feel, you lose a few, but you keep on fighting." That's what I'm trying here.


  • My speculation stocks : 


ITMN +6.2% Just like I said, the growth stopped. Could've sold it, but I was interested what was going to happen.
L +3.2% I will sell, because there's nothing to expect. It has been fluctuating between 39pt and 43pt for 6 months.
SBUX +1.2% Though the increase is slow, at least it's steady and Starbucks is a francise based on the number of customers, which is in the moment, increasing for sure.
ALXA -6.8% I sell, but will wait for an opportune moment for buying again. Simply I like the fundamentals (I mean news) of the company and the stock's movement.
KIM +2.3% Most certainly i will dump it, because it has made me nothing comparing to the market.
Average +1.2%
Week's S&P 500 +0.8%

Conclusion - the long-term shares have been better, but one week shows nothing yet.


*S&P 500 - An index of 500 stocks chosen for market size, liquidity and industry grouping, among other factors. The S&P 500 is designed to be a leading indicator of U.S. equities and is meant to reflect the risk/return characteristics of the large cap universe. 


*short selling - The selling of a security that the seller does not own, or any sale that is completed by the delivery of a security borrowed by the seller. Short sellers assume that they will be able to buy the stock at a lower amount than the price at which they sold short.Selling short is the opposite of going long. That is, short sellers make money if the stock goes down in price.


Saturday, January 5, 2013

Week 5

This time I'll tell you more about technical analysis, due to it being mostly left aside in my previous post. But first, I will talk about the announcement concerning the 'fiscal cliff'.
Here's the conclusion's simplest explanation of January 2nd announcement : 

  • The market was absolutely bullish (positive) that day and has been bullish for the whole week, because for 98% of the Americans and small businesses don't have their taxes increased. Taxes only increase for the wealthiest families. All in all, the final result of the change is much less agile then the market projected (predicted). 

  • Regarding this, I saw a great opportunity and bought shares of two stocks that I saw potential for growth and also, these two have been in my watch list for a week now : 
ITMN +6.1% which is a rapid increase for 2 days. had a triple bottom indicator and also a gentle growth trend that is not risky. Also shows an efficient MACD. Unfortunately It will change in a couple weeks. Why? Explanations are below the chart.


  • The trend is trustworthy and not risky as long as it's below 45-degrees comparing to the horisontal. When the trend is getting too rapid and steep, there's a risk for the trend to change from bullish to bearish (from positive to negative). Examples : 

  • The second reason the trend will change is MACD. As I explained in one of my precious posts, MACD works like this : when the blue MACD line is above the green signal line, it shows a bullish trend and vice versa. Now in case of  ITMN, there's a very small chance for the MACD line to stay above signal line for very long. Maybe 1-2 weeks. Then they cut into each other and when the MACD line moves below signal line, this is the sign for selling.


  • The other stock I bought is SBUX (Starbucks) +3.8% in two days. The reason I bought it was also the 'fiscal cliff' positive outcome and second - rounding bottoms. The new indicator helps helps recognise the point where the trend changes. Though the SBUX changing looks much more fluctuating and bigger than in the example, it is not. Just look at the percentages (share price). Also It's important for the volume to grow simirarly to the example. 

  • Let's get to my previous investments : 
ALXA +0.4 To be honest, I predicted at least 5% increase by now, but I think it still has potential and I'm holding it.

KIM +2.8% I've been holding it for a long time now and in case it won't reach 7% in a week, I'm dumping it. Frankly, there's a rally out there in the moment and in those moments it's important to search for a stock that keeps up with the rest of the market or that moves even faster then the rest of the market.
L +1.4% I will sell it next week because of the slow movement. The trend-change signal wasn't strong enough, either. Which means, there's a possibility for no change and no fast movements.

What will I do next ?

One of my blog's readers suggested a very good blog that helps you notice the stocks that are underrated my the market and that actually have very good fundamentals, which means a long-term growth. notablecalls.blogspot.com


  • From that page, I found a retailer FRAN stock that certainly has strong fundamentals, also triple bottom indicator and good MACD. Moreover, it decreased 25%, because the market overreacted to the resignation of the CEO. Usually, when the hit is that huge, it is caused by weak results, but FRAN had good results.All in all, I'm buying and will hope a 10% increase in next two weeks, especially on bullish market.


What is the overreacting market ?
It means when first something bad or good happens to the company. For example, the quarters results are a disappointment or the news announce that a CEO resigns etc. Then secondly, the market takes it too seriously and start selling. The share price decreases too much. One way to analyse this, is to use P/E, which I introduced in my previous post. It shows, if the share price is too low or high for its results. For example, when the market overreacts because of little worse results than predicted and the price plummets, the P/E might be below 10. If you believe that this company's shares should cost more then the current price and it's just the market overreacting because of something that doesn't really affect  the results in the future, you should purchase it.


Now, I have been wanting to see, which way is better for investing - speculating* or long-term investments (over a year). In order to test that, I will make a long-term experiment. I will buy three stocks that are not very fluctuating and that are constantly decreasing/increasing. Same time I will continue to trade within couple weeks, which I have been doing here.
The three stocks are Ford, Citigroup and Pfizer. I'll keep you in the loop, how they are doing.
Guess, we'll see if the quote "The mother of all evil is speculation." is true.

*speculation - The act of trading in an asset, or conducting a financial transaction, that has a significant risk of losing most or all of the initial outlay, in expectation of a substantial gain. With speculation, the risk of loss is more than offset by the possibility of a huge gain; otherwise, there would be very little motivation to speculate.


Happy new year, I hope 2013 will be prosperous !


Saturday, December 29, 2012

Week 4

Before I get into my this week's investments, I would like to say what I personally think about macro economic's future and long-term profitable investments.

  • First of all, economy is supposed to go up and down, that's how money is made on the market. A psychology behind spending money always stays the same. In 2008 when the financial crisis began, no one cared about spending money on self-actualization aka luxurious items, everyone understood the true value of money. Now, 4 years later, people start spending, stocks starting to climb, earnings recovering. People started to lose their conservativeness. But, as the book "Rich dad, poor dad" pointed out : "The stock prices are too high, when cab drivers start talking about the market." That is a good and simple indicator. Don't spend your time in a cab tweeting. I advise talking to the driver, see what he knows. 


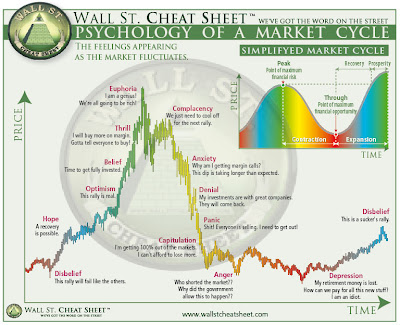
  • Secondly, about a year ago I found a perfect chart describing the macro economy. Bigger picture : http://steadfastfinances.com/blog/wp-content/uploads/2010/06/Psychology-of-Market-Cycles-via-Wall-Street-Cheat-Sheet.jpg


Now I suppose we're at the beginning of the blue. How? Everybody is speaking about the crisis in Europe, especially Greece, Portugal, Spain and Italy. But first, they're quite a little part of the world, and secondly, I believe that they will overcome this. This is why the EU was created, to stabilize the economical situation of different countries, which in this case are neighbors by the location. I believe, Greece will have its huge bailout from their debt, Italy has already overcome theirs and I also think Spain and Portugal should take Argentina's example and default, that would be smart thing to do. But that would be a little too extreme and probably won't happen. Moreover : http://www.slate.com/articles/business/moneybox/2012/05/spain_greece_and_portugal_should_quit_the_euro_it_s_the_only_way_to_save_their_doomed_economies_.html

  • All in all, the market is supposed to go up and down and the news surrounding it is simpy the noise. But hey, guess that's why the 10% get it right every time and the rest 90% always lose money betting on the market too late. The reason economy will not crash in the moment is that we are ready for it. Before the 2008, most of us didn't expect any crisis to come, because we were literally living in a bubble. Also, I think it might be happening even faster and faster in the following years, because that's how the trend has been so far. It's not impossible that the green peak might be coming already in 2015.


Now, a few words about the future developments. Well, two months ago I learnt about something interesting concerning the energy market in the next decade. More precisely, alternative (green) energy.

  • 15 years ago, the first electric cars, that could actually hit the market someday, were introduced. The biggest shareholder on the energy market, Exxon Mobile, bought the license. Now, license applies for 20 years. That means, 5 years from now the per cent of electric cars on the market will rise quickly, because other companies will have unlimited right to sell those. Sure, Exxon has loosened the strap, so the first lithium-ion battery EVs (electric vehicle) could enter the market. Probably Exxon wants to see, how the market reacts to the high price of EVs. That's why all the EVs right now, have a simple lithium-ion battery, which makes it expensive. In the future, the battery technology will develop fast, because already now there has been invented nano batteries, which are able to contain much more energy than usual lithium-ion batteries. I found a simple paragraph comparing the lithium-ion and Carbon Nanotube (one of the many possibilities of nano batteries) :  
  • The major difference comes from a typical lead acid battery providing 12-15 kW-hours of electricity or a range of 50–100 miles, where the CNT lead/lead-acid battery will deliver 380 miles distance between charges. This battery could also be recharged in under 10 minutes. The typical lead-acid battery has a recharge time between 4 and 10 hours
  • This is a huge step and probably there's more coming in 5 years. That's why I would recommend investing in hybrid car or electric car manufacturer. For example, Nissan, Mitsubishi, Opel, Tesla. Or, though more risky, invest in the battery companies and there's a possibility for them to grow dozens of times. But there's a pretty huge risk involved, because they have decreased rapidly during the crisis. For example : Altair Nanotechnologies, A123 Systems.


Now let's get to my investments this week :

ALXA -2% the pharmaceutical company that had decreased 14% and then had good news about the FDA approval on their new drug. Still hadn't been making its growth, but I think increase will come because it has a rising trend with a certain main-line and channel-line. 


ALXA 1-year history

KIM -1.1% still has the trendlines, basically same chart as last week, between the trendlines. Waiting for a 2-pt aka 10% rise in next 2 weeks. If won't happen then I'll just "sell the fucker" so to speak.
L -3.2% same thing as KIM. 
They're both waiting for the fiscal cliff accouncement. It means the US. government will decide how much the wages and the taxes are going to change in order to improve the macroeconomy. The Republicans and Democrats will find the compromise by the end of this weekend, but good news is that president Obama has softened his conditions so the 'cliff won't be that rapid'. The whole market movement on the new year's first couple days depend on that. Moreover : http://www.huffingtonpost.com/2012/11/09/obama-fiscal-cliff-speech_n_2102168.html

Next :  I'm going to buy Wellpoint (WLP) - I like its P/E of 7.94, which means it's underrated by the market. Also I like it's fluctuating price. I just might wait a little bit, so also the triple bottom would be complete, because so far it has been working well for me, so there's no reason not to trust that. Also MACD is should rather be crossing zero-point before the rise not be on the top.

WLP 1-year chart

More about technical analysis next week!

Happy new year.


Sunday, December 23, 2012

Week 3

Sex, drugs and rock'n'roll . Why am I starting my post like that? Because entering these three words simply helps me to get to top pages in Google search. There's a useful marketing tip.
Now, about investing this week :
First of all, my brother gave me advice of putting everything, that is a little next level for part of the readers or maybe just some extra text, in italic.
Though I was still looking for stocks with break points (from fall to rise) with technical analysis, I must admit, it was hard to find. At least on NYSE (New York Stock Exchange) and Nasdaq (US. Technology Stocks). So I went to search for good fundamentals. Fundamental analysis is all about the earnings and management. The basics of fundamental analysis : http://stocks.about.com/od/evaluatingstocks/a/Fundanatools1.htm


Now, the P/E is a tool for measuring if the stock is overvalued or underestimated. 
If P/E is
below 10 - underestimated and if you can see the potential for earnings growth in the future before the rest of the market, it's smart to buy.
10-20 - the market has valued the stock correctly in the moment and liquid (bigger the liquidity, bigger the chance to get your money out quickly and smaller the chance of losing your money through bankruptcy)
over 20 - the market has overpriced the stock and you should be careful, because if the market realizes the mistake, stock will face a correction (very important notion, which means that sometimes the news and current good financial situation starts to boost people's ego and makes them feel safe financially. Just like the boom 2006-2008. It means when the stock is overpriced and probably gonna fall, then investors say the correction is about to emerge.)

Perfect example of how easy it is to make money basically without any indicators, just research :
An investor named Chris Camillo, who wrote a book called "Laughing at Wall Street", where he talks, how he turned 20 000 $ into 2 000 000 $ with three years.
In estonian language it's possible to read here https://fp.lhv.ee/news/4668783
All in all, all he did :
1. went to clothing store with his wife, where he found a line with 150 people waiting and after couple hours they all got informed that in the whole country, the new collection is sold out. But there was nothing in the news, so the market didn't now nothing about it. Mr. Camillo made his conclusions and bought the store's stock. With 48 hours his money had been tripled.
2. the pharmaceutical company's new drug had failed some clinical tests and investors lost interest. He kept talking to the specialists and reading the company's reports for a couple months. He understood that though all the negative results in the past, the drug will pass all tests and bought it for 2.95 $. A month later, it costs 20 $. "The illusion has become real"
All I'm saying, keep your eyes opened.

Now let's talk about my last week's investments :


  • I made a huge mistake by selling NKE (Nike) too early. I only earnt 0.8%, but the day after I sold it, Nike profits tops estimates and shoots up 6.1%. Another certain mover is always stock's earnings beating its estimates. Also, the retro Air Jordans came into stores and store lines where huge and that hit the news. Probably is gonna rise a little because of the good news and all the fuss.  But be careful, because NKE has P/E of 23, which means moving into risky zone there.
  • JNPR made its 2-week rising (triple bottom) and probably gonna slow down now. That's why I sold it, made 5% profit. JNPR P/E is 56, which means it's overrated and probably is gonna fall in long term. It's a smart move to get out.
  • A has the same case as JNPR and made 6.6% profit. But A has P/E of 10, so it's liquid (The ability to convert an asset to cash quickly. Also known as "marketability")
  • KIM is +1% in the moment, which for 3 weeks is not very productive. But I'm holding it because MACD indicator (the lower one) favors it. But I will keep being watchful, because it has P/E of 55
What is MACD indicator? Video is the best way to learn this http://www.youtube.com/watch?v=k9nds4OpA2I. 

If the blue (MACD) and green (Signal) line crosses the 0.0 (zero point) and blue line is above green line, it means the stock is bullish. But when these two cross each other and blue line is gonna go under a green line, the stock turns bearish. 

Bull market - A financial market of a group of securities in which prices are rising or are expected to rise
Bear market - A market condition in which the prices of securities are falling, and widespread pessimism causes the negative sentiment to be self-sustaining. As investors anticipate losses in a bear market and selling continues, pessimism only grows.


  • Now, L has an P/E of 18, which sounds promising and not that risky, which is good. Though it's -1.45%, I will hold it, because the MACD indicator tells me to. It's the same case as KIM. Just gonna post the graphs : 


Now, what am I gonna buy next?
I simply chose from the stocks that fell the most last week and found :

  • ALXA is a pharmaceutical company that got FDA approval to its agitation drug. But in a funny way, with the last day + after hours trading it has fallen -20% to 5 pts., which I don't get. Though EPS (earnings per share) is negative, the MACD shows bullish market. It's the biggest risk I have taken so far, but I'm willing to try.


There has been a huge fuss about 'fiscal cliff' all over the news. It means that in the beginning of 2013 the taxes will rise, so companies suffer. But, same time US. is decreasing its debt, which is a very good sign to macro economy. In conclusion, I believe that it might effect the stock market for a first couple a months, because the earnings decrease marginally. But everything will go on as it is, because in long-term it helps US. economy.

Good page to learn investing for an intermediate investor, everything about technical and fundamental analysis :
http://stockcharts.com/school/doku.php?id=chart_school/

Have a good christmas, next week, new post!


Saturday, December 15, 2012

Week 2

2nd Week

The end of this week the market indexes (S&P, Dow and Nasdaq) have fallen 1%, which is a pretty agile falling. The reason is a fiscal cliff aka the Budget Control Act,  starting 31 december 2012 midnight. Easiest explanation for The Budget Control Act I could find : Among the laws set to change at midnight on December 31, 2012, are the end of last year’s temporary payroll tax cuts (resulting in a 2% tax increase for workers), the end of certain tax breaks for businesses, shifts in the alternative minimum tax that would take a larger bite, the end of the tax cuts from 2001-2003, and the beginning of taxes related to President Obama’s health care law.
 In summary, businesses pay taxes to health care. Which means, they lose money. Which means, traders start selling and price decreases. Now, what we did here, is called fundamental analysis. It is mostly based on overall state of economy, companies management and balance sheet. Techincal analysis, which I'm testing in this blog, is simply trying to predict the stock's movement and is not that much affected by company's results .

Now, let's see what has happened with my portfolio : 
In total (in 2 weeks) : 
NKE -0.58% . Will sell, because it hasn't worked out as I hoped and there might be coming a fall and a triple bottom. If the movement hasn't been as predicted and it doesn't seem to be going any better, sell the fucker. There's no point just holding your money there and just hope for the situation to get better. Probably it'll get worse. Of course dumb luck might make the stock go up, but that's a rare occasion.


KIM +0.16%; nothing to say about that

A +4.07% - a week ago it was -1.25%

Stocks bought week ago : 

JNPR +2.19% - triple bottom; has risen as presumed and probably gonna sell next week, because in a couple a days the movement will stop

L -2.05% - bought it because of the famous head and shoulders indicator. though it hasn't moved according to that indicator, I will still hold it because at a large scale's uptrend it will bounce up from channel line (below) soon and when it does, I will sell it immideately. If the stock hasn't been acting as predicted and has fallen fast then before "selling the fucker" try to analyse and stay calm. There's a quote about it in Wall Street : "First lesson in business is don't get emotional about stocks - it clouds your judgement."


Guess this is it for the week. Won't be buying anything new next week. Chill.